Project Description
Oil prices are a staple in tickers that scroll across the bottom of the screen on channels like CNBC, MSNBC and Bloomberg. WTI and Brent crude prices are quoted in the news all the time. Most people have little to no interest in the price of oil beyond how it impacts the price of a tank of gas. Others, however, follow these price movements with great interest. Oil companies, energy providers and mineral rights owners all want to know what current oil prices are and if they are going to go up or down in the future.
Of course, no one can accurately predict what the price of oil will be in the future, but we can look at past prices to help us understand where current prices are relative to historical ones. It is often helpful to know if oil prices are high or low relative to where they have been previously. If prices are currently much higher than they have been historically, it may indicate prices will fall in the future, and vice versa – a ‘reversion to the mean’ in statistical terms.
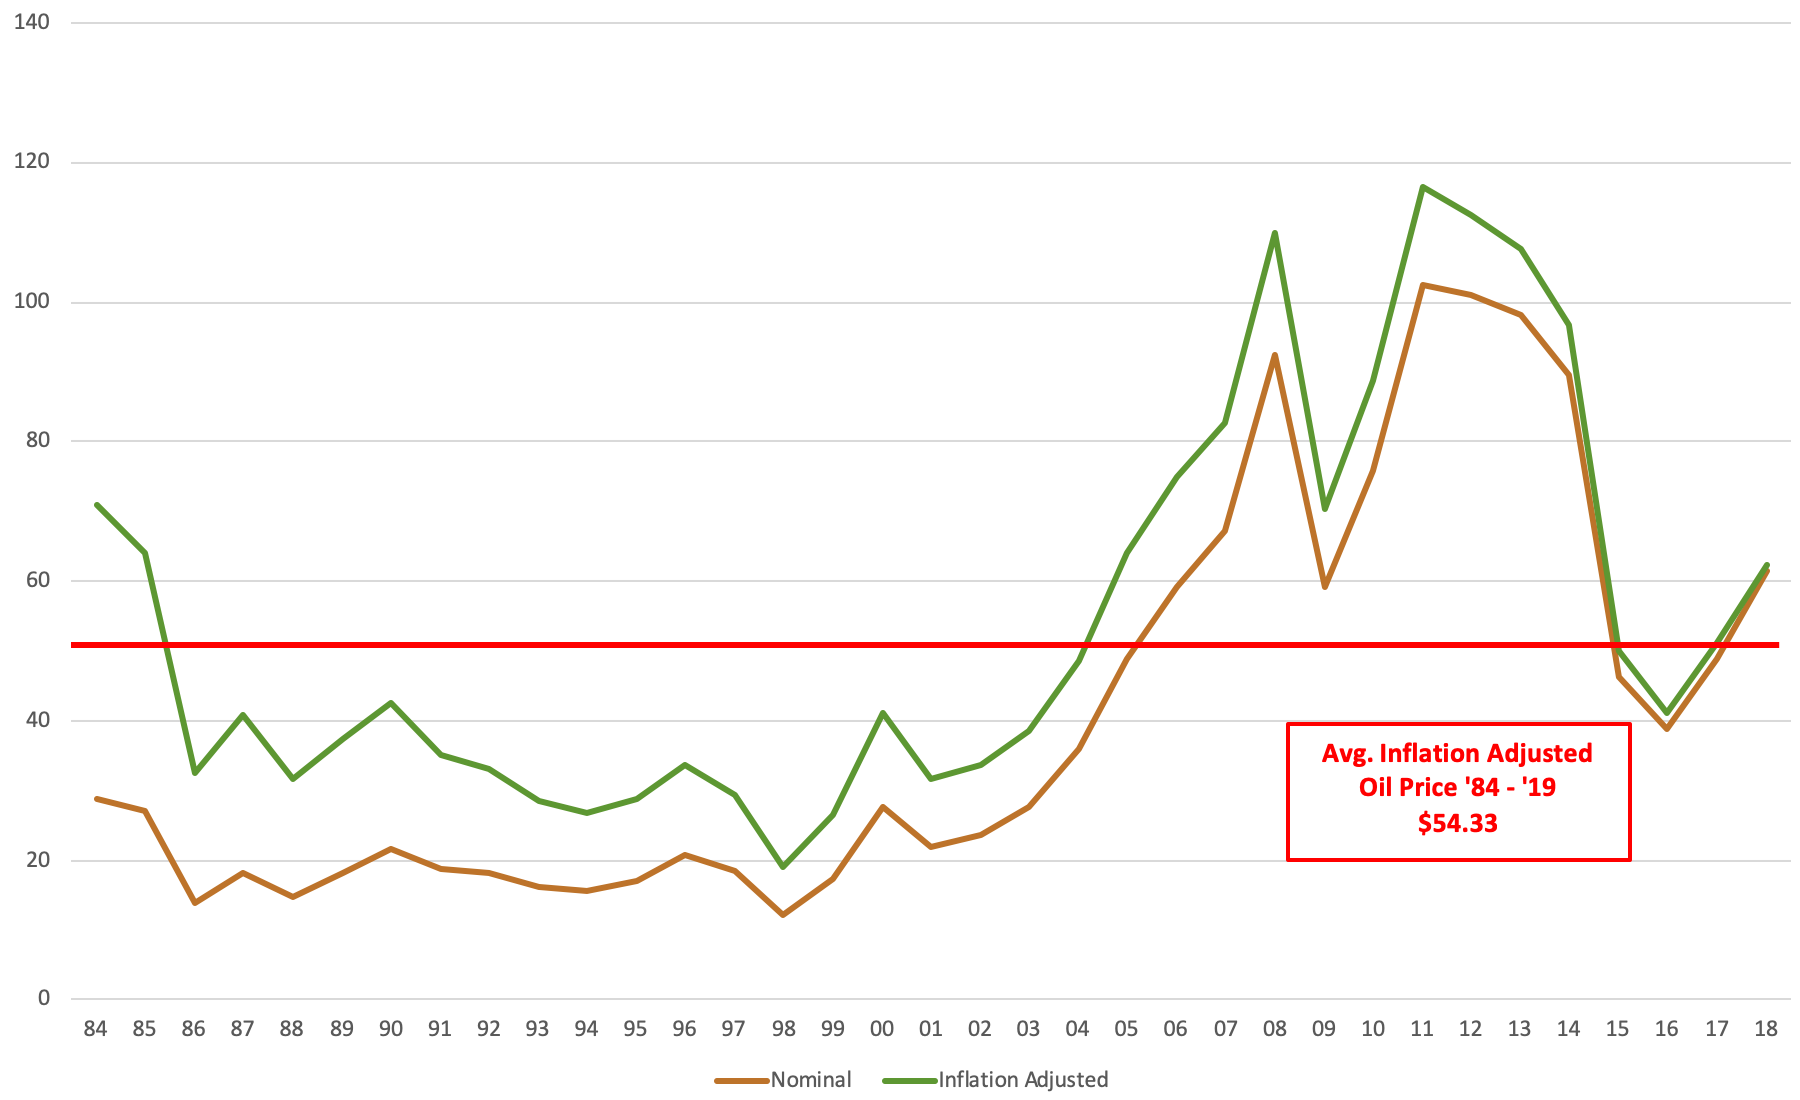
As of this writing in mid-2019, oil price sits at $62.00/barrel. Is that a ‘normal’ or ‘typical’ price for oil? Too high? Too low? Let’s take a look at historical prices in the chart below to see where $62.00 oil sits, relatively.

As the chart above shows, which is based on data from the U.S Energy Information Administration (“EIA”), the average inflation-adjusted oil price for the last 35 years is $54.33/barrel. Relative to this, today’s oil prices are ‘high’ by approximately 12%, which suggests oil prices may decrease in the near future.
It is important to note that when looking at oil prices over time, an inflation-adjusted number should be used. A dollar today is worth less than a dollar was 35 years ago. By removing the impact of inflation, we are able to compare the price of oil “apples to apples” over time.
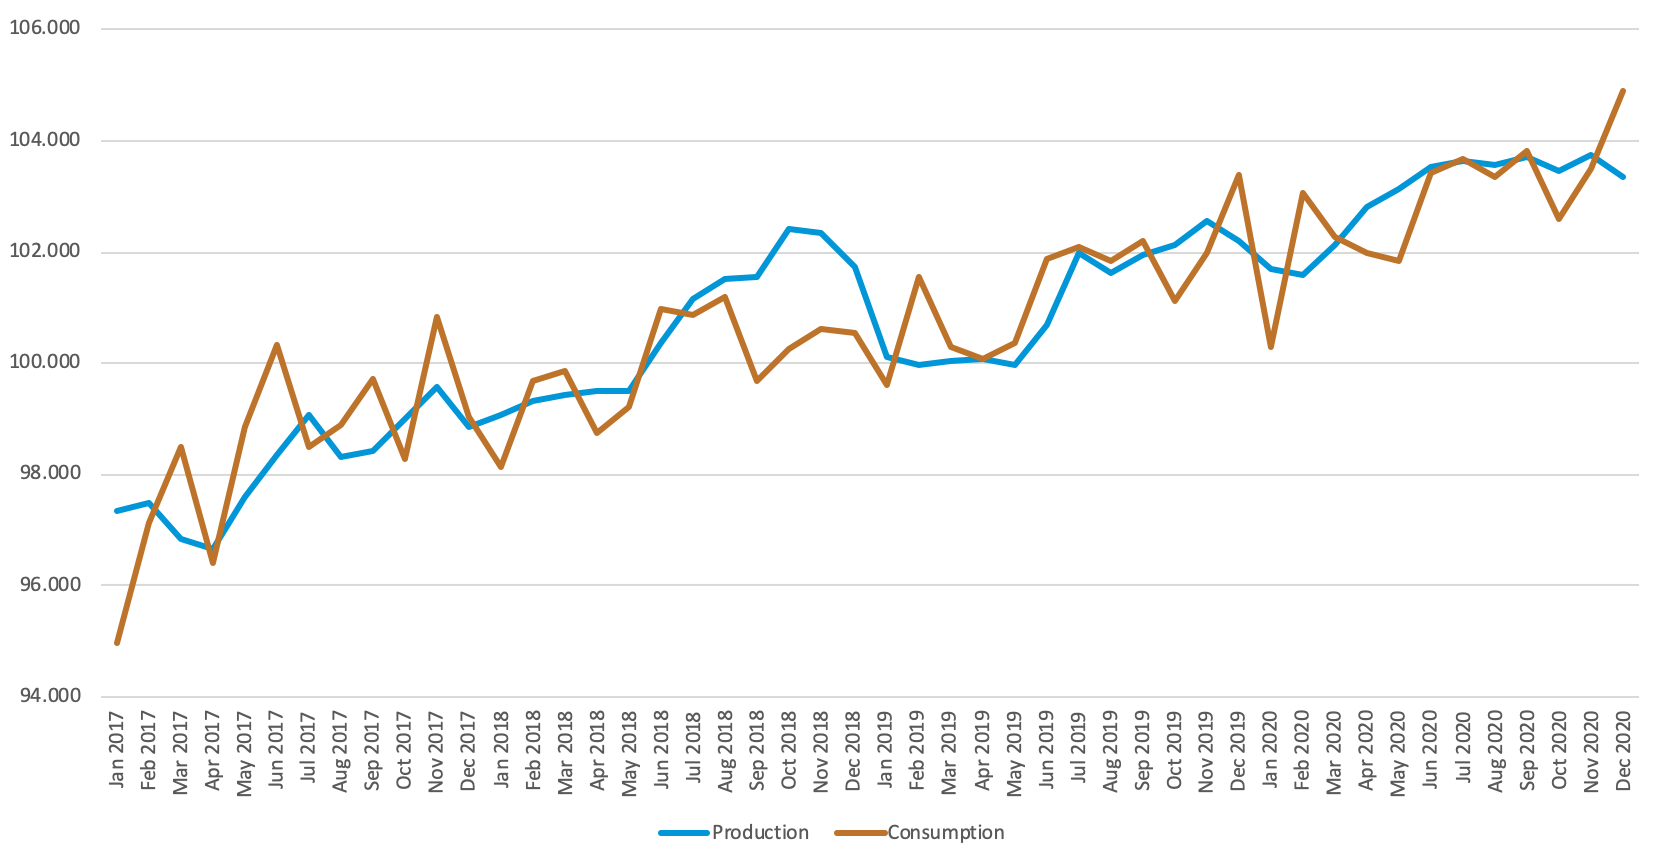
Now, of course there is more to the story than just price. Price is simply a function supply and demand. If oil consumption (i.e. demand) had risen over the last 35 years, but supply has remained flat, we would expect to see oil prices to sky rocket since it would become an increasingly scarce commodity. In reality, more oil is produced than there is demand for at any given moment, creating an inventory, or an excess of oil. Increasing inventories means more oil is being produced than used, which generally will drive prices down, while decreasing inventories means not enough is being produced, which will often drive prices up.

The chart above, again based on information from the EIA, plots daily global oil consumption against production from 2017 through 2020. As we see, production is expected to slightly outpace consumption over this time frame, to the tune of an inventory increase of ~83 million barrels. Because supply and demand are projected to effectively be in-line, a significant movement in oil prices shouldn’t be expected.
With all the above taken into account, it is reasonable to expect oil will fall back in line with its historical inflation-adjusted price of ~$54.00/barrel in the near future and stay there for foreseeable future as well.


